|
In SmartDevicesPlus 5 were included some improvements in Charts. Below are explained in detail.
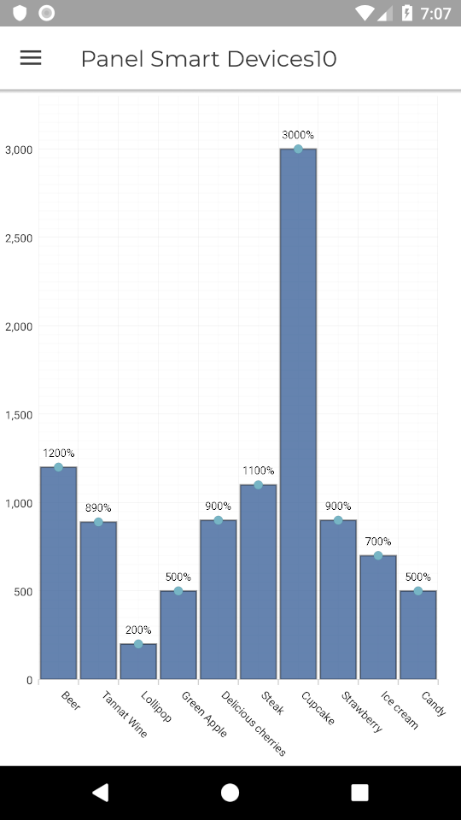
This property allows to show the values of the Series on the Chart. The possible values are:
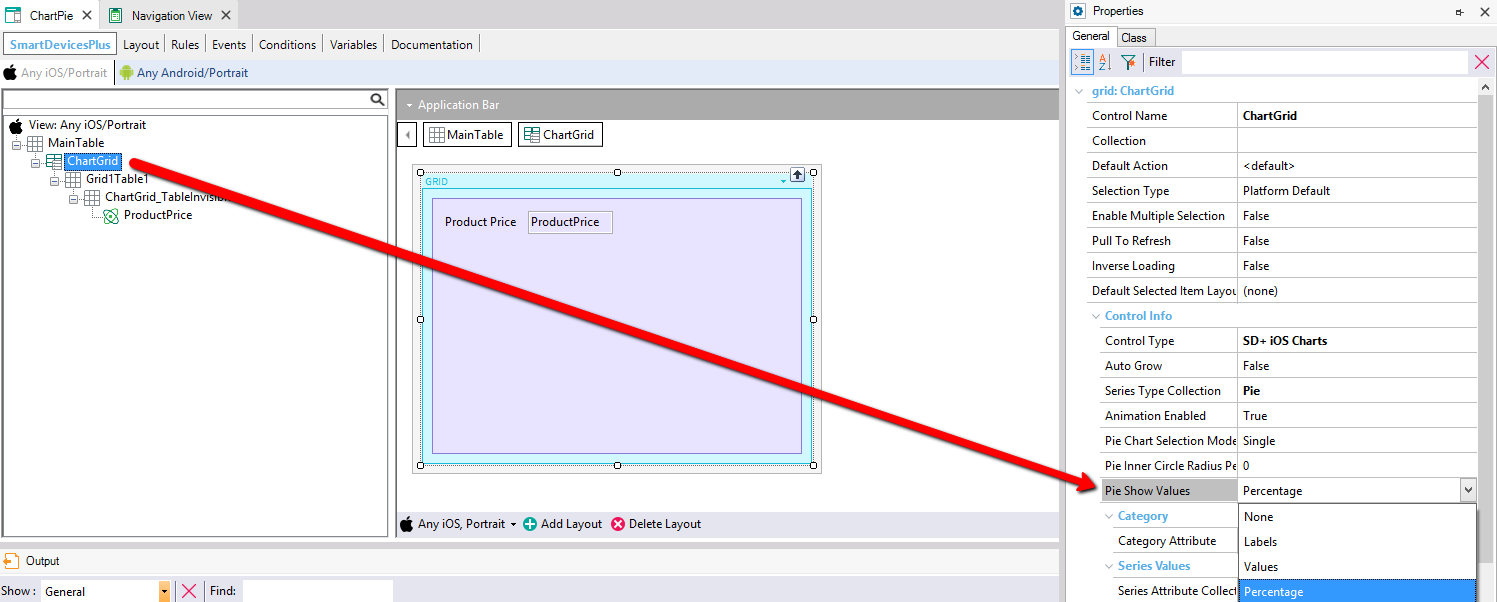
- None.
- Labels: show the label of the serie:
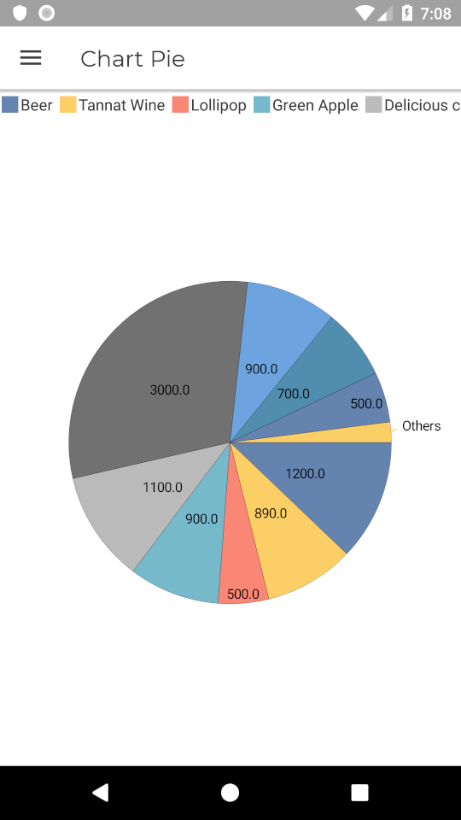
- Values: show the value of the serie.
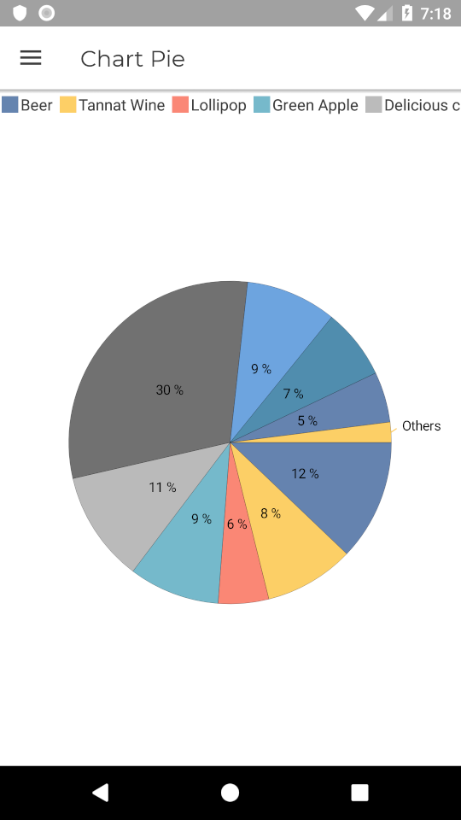
- Percentage: show the percentage which occupy this serie.
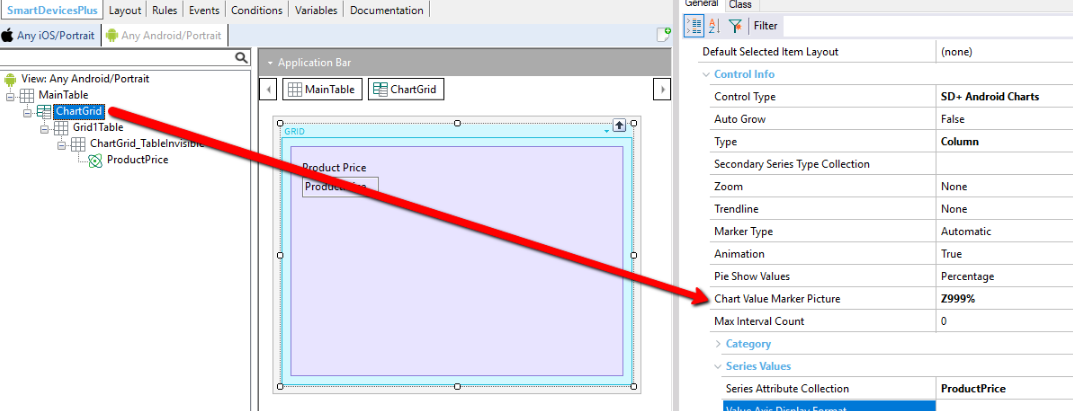
This property gives the possibility to add format to the Series Values. The supported format are the same of the ones you can use in the "Picture" property of Genexus.
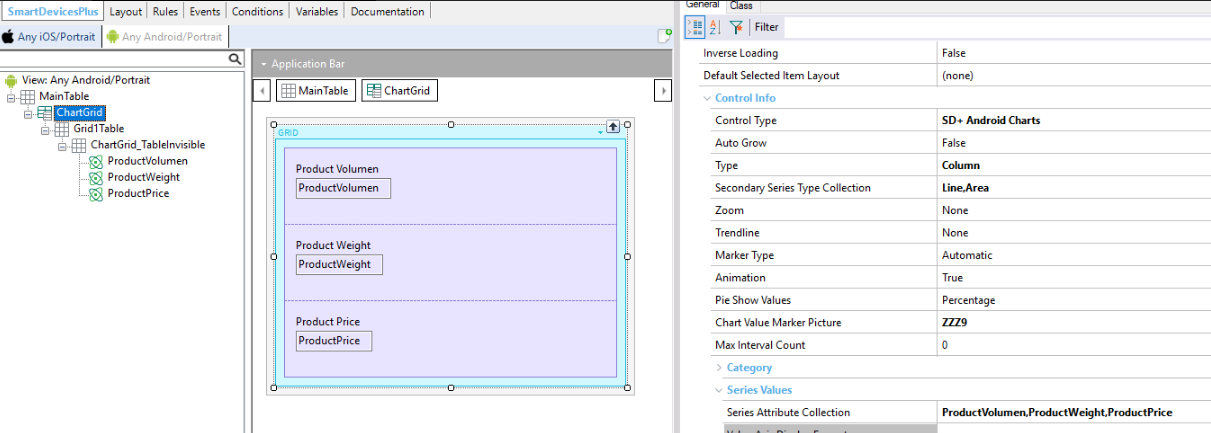
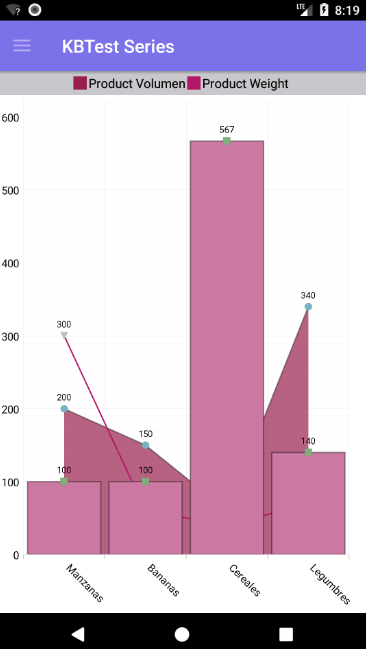
This behavior is achieved with the property "Series Type Collection". In this property you need to select the Chart Types which you want to combine.
The possible combinables series are:
- Area.
- Column.
- Line.
- SPLineArea.
- SPLine.
- StepArea.
- StepLine.
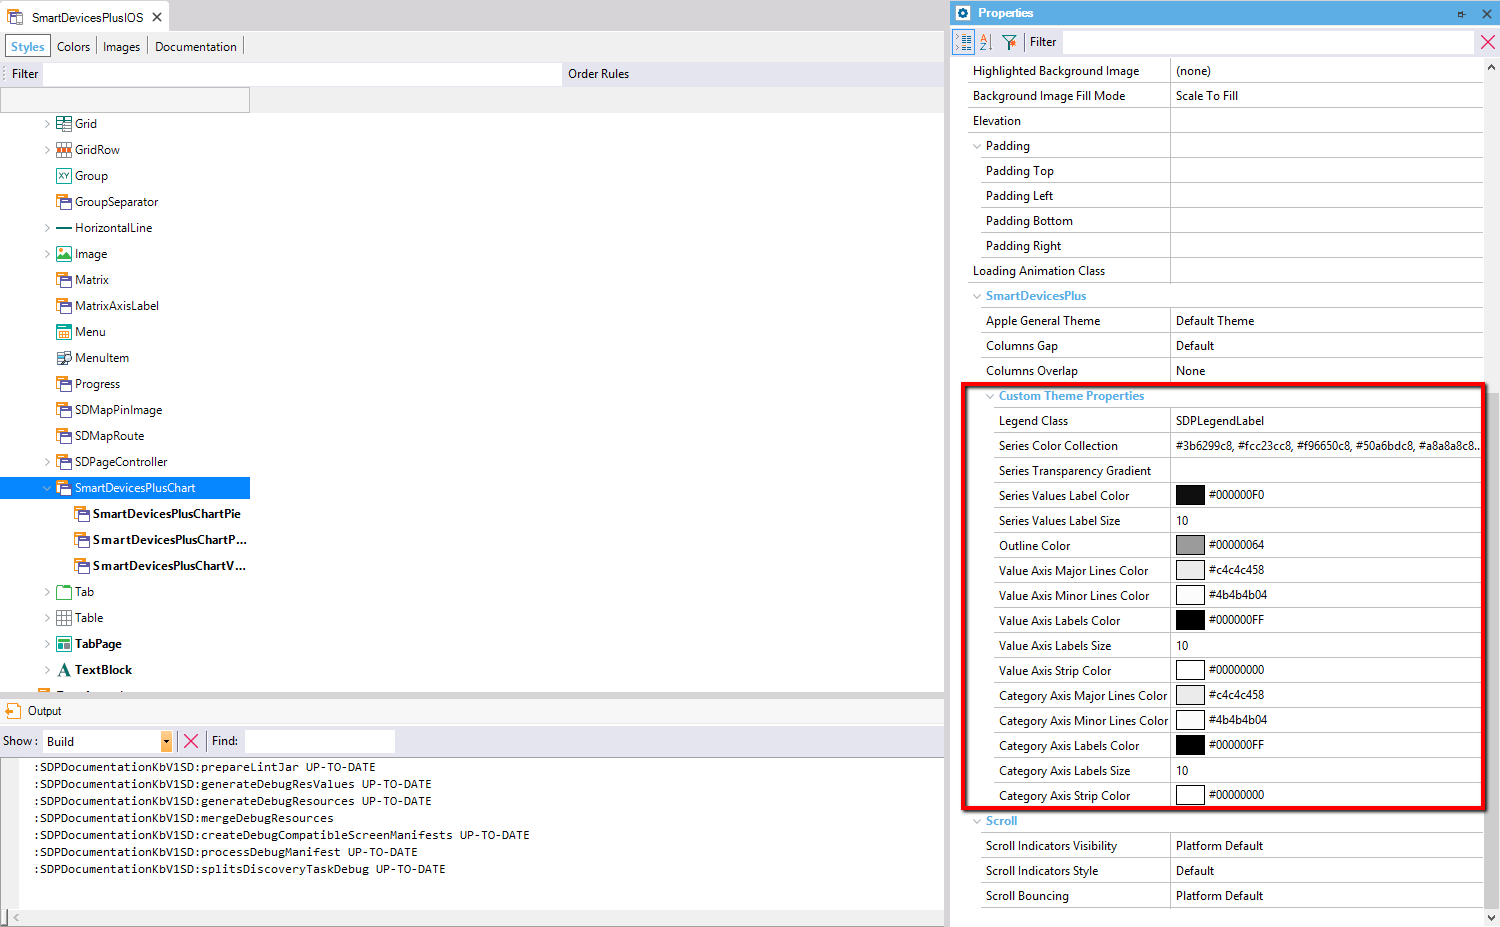
In this version is supported to change the color of the charts in this platform. This was already possible in Android.
|